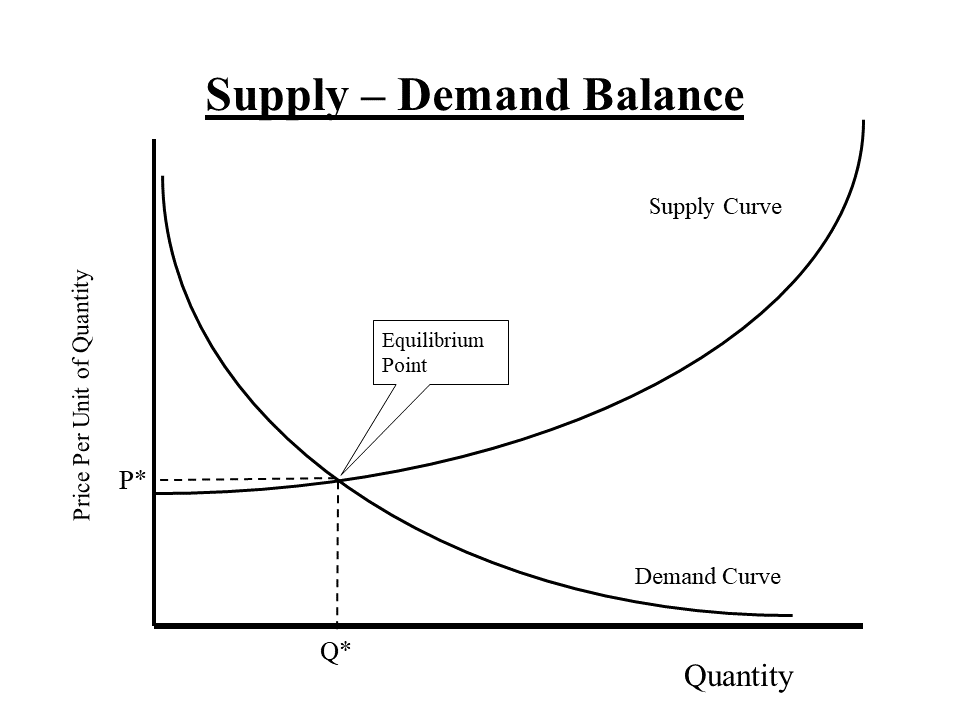
Putting the two curves together – and we get the famous Supply-Demand Balance graph.
For any given product or service, at any given price – only a particular quantity is demanded and supplied.
Any individual supplier can try to charge consumers more than the Equilibrium Price,
But competitors will steal the customers away by charging less.
Any Individual consumer can try to negotiate a cheaper price than the Equilibrium Price,
But, in the long run, and on average, Suppliers cannot continue to do business at prices below their Total Economic Costs of Production.
Of course, since there are many suppliers, each with their own unique supply curve,
and many different products that are almost interchangeable,
a prudent consumer will shop around to find the best price for the most desirable product.
The intersection of the two idealized curves is the “Equilibrium Point” – the price at which the same quantity is Demanded as is Produced.
Now of course, as you would expect from what I have already mentioned, this picture is an idealized rendition of what really happens in the market place.
There is constant fluctuations in the Demand Curve as a result of changing consumer preferences,
and constant fluctuations in the Supply curve as a result of constant changes in production costs.
But the Equilibrium Point is the “Attractor” – it is the point where all the Incentives push toward.
So lets see what incentives are in place when the Reality is different from the Equilibrium Point.
